Text Box: FEBRUARY 2003 WET SPELL OVER PAKISTAN
Azmat Hayat Khan*

AlThough records of rainfall amounts were not broken at a number of stations in upper parts of the country, February 3rd week rainfall was record breaking in relation to duration, storm occurrence and hydro-meteorological perspective for more than two decades. Persistent rains and snowfall in the catchment areas had recharged main reservoirs. Small dams had been filled to their capacity whereas level of Mangla reservoir raised to more than 50 ft.

Antecedent Conditions

A wet-weather pattern persisted over upper parts of country for six days. This pattern had resulted from an eastward-flowing jet-stream that extended from Middle-east to northern India. Because of this jet-stream, a weather-front convergence zone formed across the upper parts of country during the period. Moist, warm air from the Arabian Sea was drawn northward along this jet-stream, where it interacted with cold air mass of central Russia. This combination of extreme conditions generated frequent occurrences of prolonged and excessive precipitation over northern Balochistan with snow over mountainous areas. In the first two days, more than 10 inches of snow fell over northwestern mountainous areas of country.

The extreme weather prompted a public debate about a possible increased frequency of such extremes due to climate change. The quantitative research of few aspects suggests that Pakistan have a Wet winter with increasing Sea Surface temperatures in the Pacific Ocean. Preliminary analysis using the current El Nino Southern Oscillation-related (ENSO) sea-surface temperature anomalies in the tropical Pacific show a response that replicates the observed precipitation and temperature anomalies to a noticeable extent. This suggests that the current long-lived ENSO event probably contributed to the large-scale atmospheric features associated with the extreme weather events. Similar, though less frequent, features were also observed in 1992. However it requires more detailed analysis, involving both observations and coupled ocean/atmosphere global circulation models, to get a definitive understanding of the role of sea-surface temperatures in the tropical Pacific in the recent extreme precipitation events.

Description of Storms

The current spell was the result of one single, large- scale event. However it triggered three smaller scale storms of shorter duration, more locally intense thunderstorm events.  The flash-flood producing rainfall events were typically the result of thunderstorms repeatedly forming and moving over the same area, a phenomenon sometimes referred to as the “train effect.” Storms of this kind usually form either along or just to the north or northwest of a slow-moving or stationary fronts aligned parallel or nearly parallel to the upper air winds. Weather disturbances moving along the surface front force the warmer air to the south or southeast of the front to rise over the cooler air to the north or northwest.

The intensity of these storms, once they formed, was enhanced by the extreme nature of the temperature contrasts across the region and the intensity of the jet stream. By the mid of February, the position of the jet-stream was firmly established over the southern parts of the South Asia with a SW-NE orientation over Pakistan.


Following a long dry period, most parts of country experienced a prolonged siege of moderate to heavy rainfall. This included extreme precipitation on February 16 in Hyderabad, which paralysed life activities in the area due to flash-flooding. A relatively small, convective pocket dumped more than 4 inches of rain on the outskirt of city. This rainfall event also led to loss of life and property in the area. Another major precipitation impulse occurred on February 19th in Sheikupura. The heaviest rains were focused farther north than the earlier events, with especially heavy rain falling over upper NWFP, northern Punjab and Kashmir.

Chronology of Storms

The following is a chronology of some of the more notable storms that occurred over the region during the spell and caused loss of life & property. Electronic and Print media also reported the events.

February 17, 2003.  Four to five inches of rain fell in Hyderabad region. The heaviest rain fell over the eastern parts of the city. The storms acted like a mini tornado and damaged infrastructure. 9 people were reported dead. Further precipitation during the next few days caused havoc in the area.

February 19, 2003. This storm was a significant event, producing a large amount of rainfall over eastern Punjab. It produced 2 to 4 inches of rain associated with a suction vortex which uprooted trees & electric poles, threw away heavy equipment and damaged more than 30 houses. 40 people were reported injured during the storm.

Rainfall Data

The National Weather Center reported this event as the wettest spell during last three decades. Hyderabad received heaviest rainfall of its history amounting to 106 mm in just 7 hrs against previous record of 38 mm in 1887 in 24 hrs. Also it was the wettest February on record as previous wettest month in Hyderabad was 1972 with 55 mm of rainfall. New records established at a number of stations in terms of precipitation amount, intensity and duration of spell as indicated in the following table.

Station Name

Rainfall (mm)

Wettest February on Record

Heaviest rainfall during last 24 hrs.

Normal February Rainfall

Total Rainfall of  feb16-21 Spell

Previous

Current

Previous Record

Current

Gilgit

6

31.5

30.7

(in 1971)

31.5

15.5

(on 4/2/1965)

25.7 (19/2/2003)

Kotli

99.1

266.9

231.3

(in 1976)

266.9

119.4

(on 1/2/1972)

154.9 (on 19/2/2003)

Muzaffarabad

134.7

283.9

Previous record holds

73.0

(on 20/2/1979)

113.9

(on 18/2/2003)

Balakot

153.5

268.5

Previous record holds

80.8

(on 18/2/1986)

113.0

(on 18/2/2003)

Dir

Normal for the month is 172.6 mm whereas 171 mm has been received during this spell

Previous record holds

81.0             (on 20/2/1979)

98.0  ( 18/2/2003)      

Jhelum

50.0

170.6

117.3 (in 1966)

170.6

86.9 (on 20/2/1979)

93.0 (on 19/2/2003)

Murree

145.0

314.0

Previous record holds

112.0 (on 19/2/1984)

122.0 (on 18/2/2003)

Sialkot

43.9

163.3

Previous record holds

74.4 (on 28/2/1971)

82.5 (on 19/2/2003)

Hyderabad

3.9

106

55.1 ( in 1906)

106

37.8 (on 2/2/1888)

71.0 (on 18/2/2003)

Chhor

2.0

20.1

Previous record holds

17.5 (on 2/2/1940)

17.3 (on 18/2/2003) 2nd highest record

Quetta

49.0

83.0

 Previous record holds

49.0 (on 3/2/1986)

54.0 (on 17/2/2003)

Geographic Distribution of Normal February Rainfall


Geographic Distribution of Rainfall (mm) during Feb 16-21 Spell

 
Precipitation amounts acro
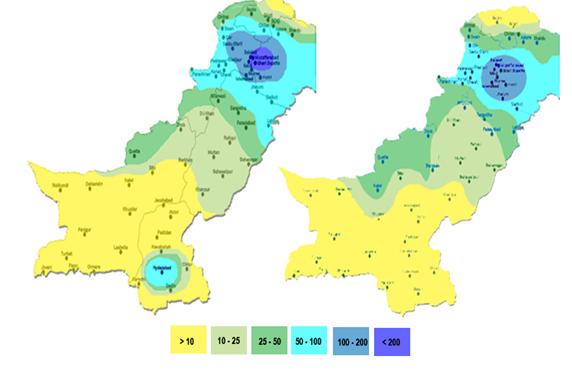
ss the country were substantially greater than normal in most areas, and more than twice the normal in some places. Most of this excess precipitation fell as rain in the low elevation areas of the country. However some areas also received hailstorm. Mountainous areas in northwestern and northern parts of country also received well above normal snowfall during the spell. For comparison, geographic distribution of rainfall received during current spell against normal February rainfall is annexed below.


_____________________________________________________________________________________________* Senior Meteorologist, Remote Sensing & Computer Division, Pakistan Meteorological Department, Islamabad-Pakistan.                       E-mail: pmd@pmd.gov.pk